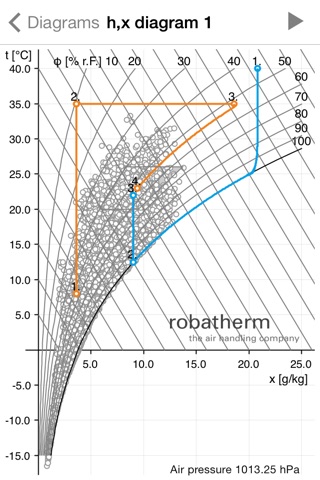
Mollier h,x app for iPhone and iPad
Developer: tarienna GmbH
First release : 16 Feb 2013
App size: 6 Mb
Heating, cooling, mixing as well as humidification and dehumidification change the state of air; the “Mollier h,x” App enables you to quickly calculate those changes.
This app offers you far more options than you’ve ever experienced when using ordinary h,x-diagrams.
For example, local weather data can be imported from all over the globe into your diagram, enabling you to calculate, determine and/or compare the local climatic condition.
You can also define the true prevailing air pressure.
Your h,x-diagram automatically adjusts itself to the entries you’ve made.
Check out this App’s wide range of options:
• Import of worldwide weather data
• Intuitive handling through direct starting point selection in the diagram
• Air flow entry for performance identification
• Clearly arranged lists of data points and performance values
• Selection of the diagram’s temperature and humidity boundaries
• Free definition of the range of comfort
• Storing and processing of multiple diagrams
• Entry of multiple, different air flow in a diagram
• Arbitrary choice of color of the air flows for improved differentiation.
• Adjustment to the true prevailing air pressure
• Create a PDF-file and send it via e-Mail


